LAST UPDATED - APRIL 2020
© 2018
Multi-dimensional Reporting
Designing the experience for a full-fledged reporting interface
PROBLEM
One of the main reasons Avocarrot Demand Platform was made for, was to satisfy DSPs (or Demand Side Partners) reporting needs. For context, DSPs are the advertisers, who want to advertise their products/services on Avocarrot Exchange’s apps. Example advertisers were companies like Coca-Cola and RedBull.
Their reporting needs were multi-dimensional. A classic scenario, would be something like this: the DSP would filter for a specific timeframe (e.g yesterday) and then split by apps and countries. This query, conceptually, would return the yesterdays numbers (ad spend, impressions etc) for each app he advertised on splitted by countries he advertised in. In a nutshell, they wanted to see how much money they are spending on Avocarrot Exchnage and where they are spending them at.
At the time, we were solving this need with weekly mails. The Avocarrot Account Manager who had established relationship with the DSP, would send every week a spreadsheet with the week’s numbers. We had an active feedback loop there; DSPs were asking for more or less data in that spreadsheet, so we had to provide a customized spreadsheet per DSP. The good thing here, was the fact that we had many insights on how DSPs wanted to view their reports and what made sense for them. So, we made a big list with all the cases and custom requests DSPs had from Avocarrot.
Our problem was clear; we had to create a self-serve interface that covers the listed DSP reporting needs. We had an initial list of metrics (e.g ad spend, impressions etc) and a set of dimensions (e.g apps, countries), and we had to design an interface that would present a potential big chunk of data. Essentially, we had to fit in 3 high level categories:
-
Metrics
-
Visualisations
-
Dimensions
From early meetings with the engineering team we listed a bunch of technical constraints. We were messing around with big data. That means, complex queries would have a high process and respond time. Data requested was making a huge journey from our infrastructure and data-centers, to end up in the front-facing interface. We should somehow manage the user expectations on the interface, while the data is being loading.
Solution
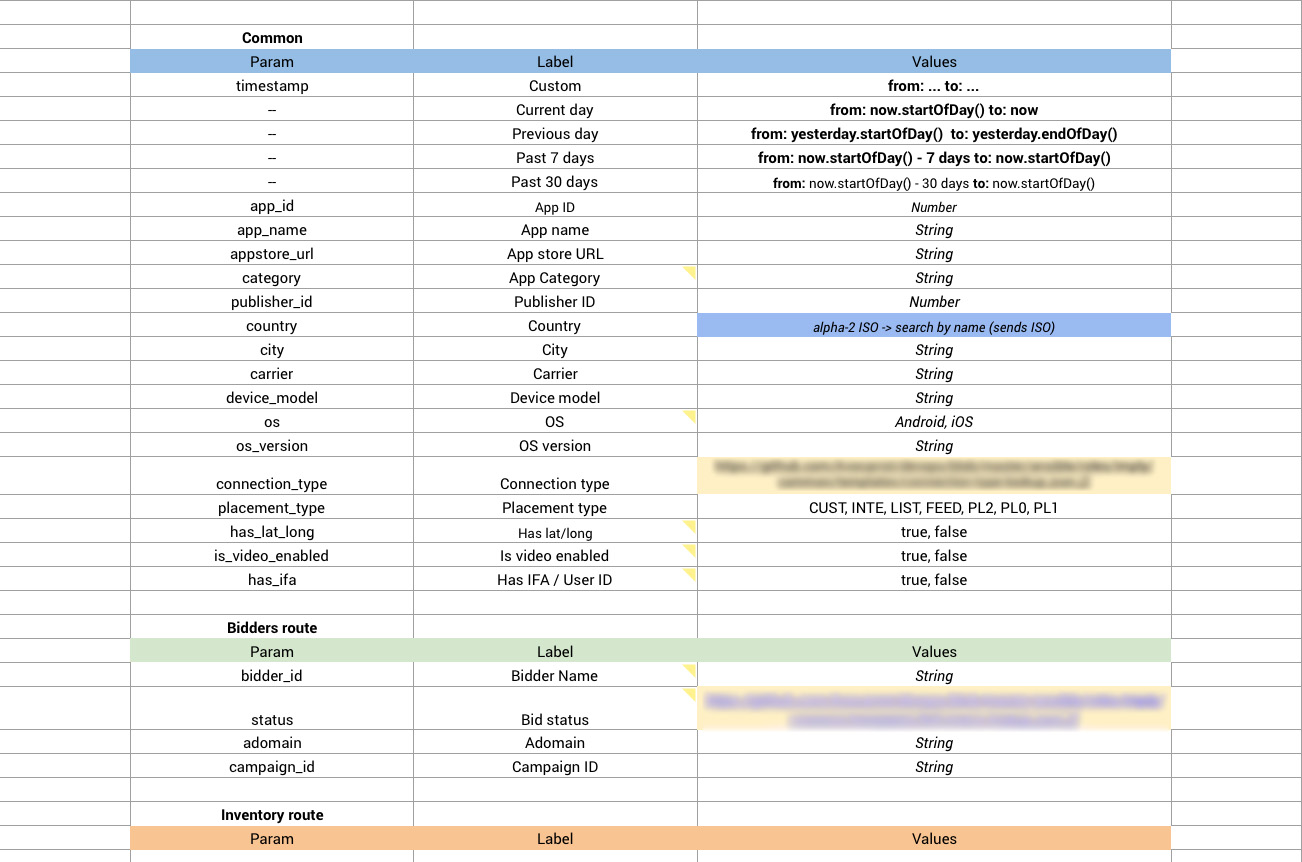
I’ve worked closely with the engineering team to map out all the dimensions in a spreadsheet. We wanted to make an exhaustive list of the the dimensions - for filters and splits. This list, helped the whole team align on what type of numbers were actually going to support, from datepicker values to app names’ values.
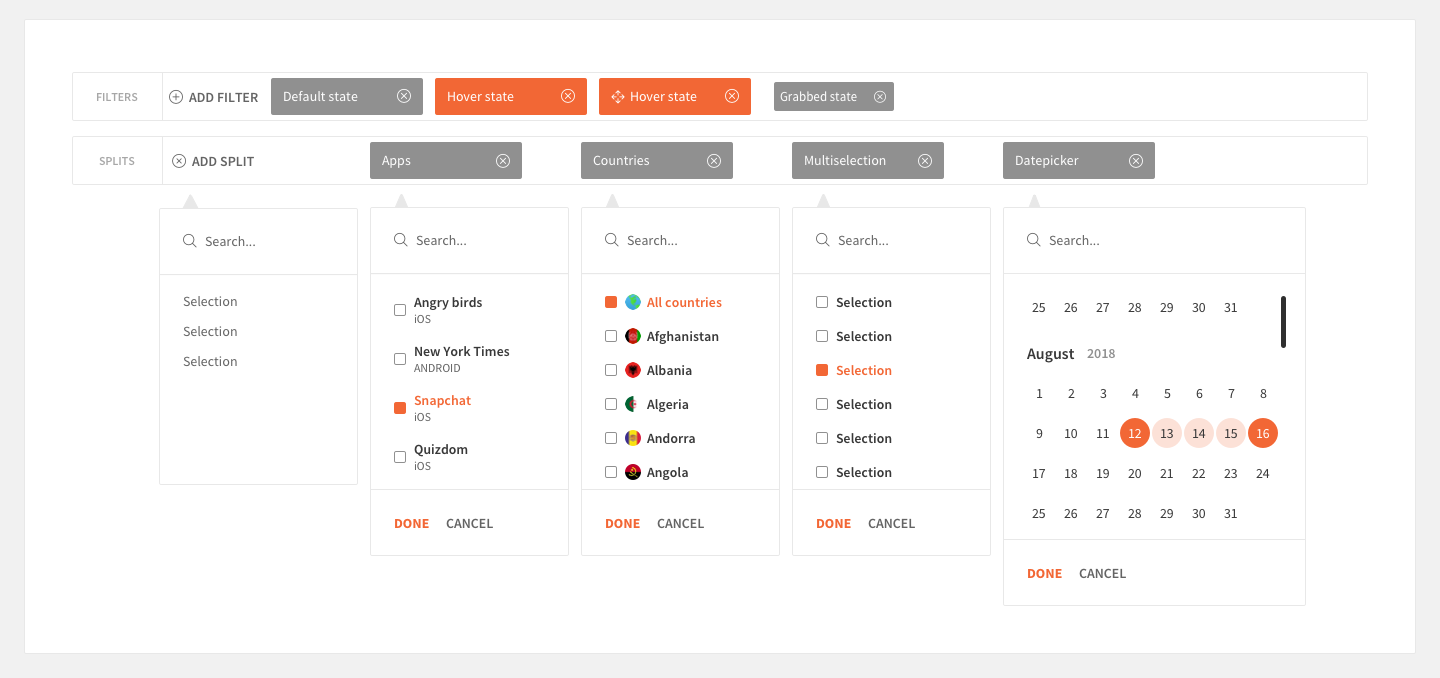
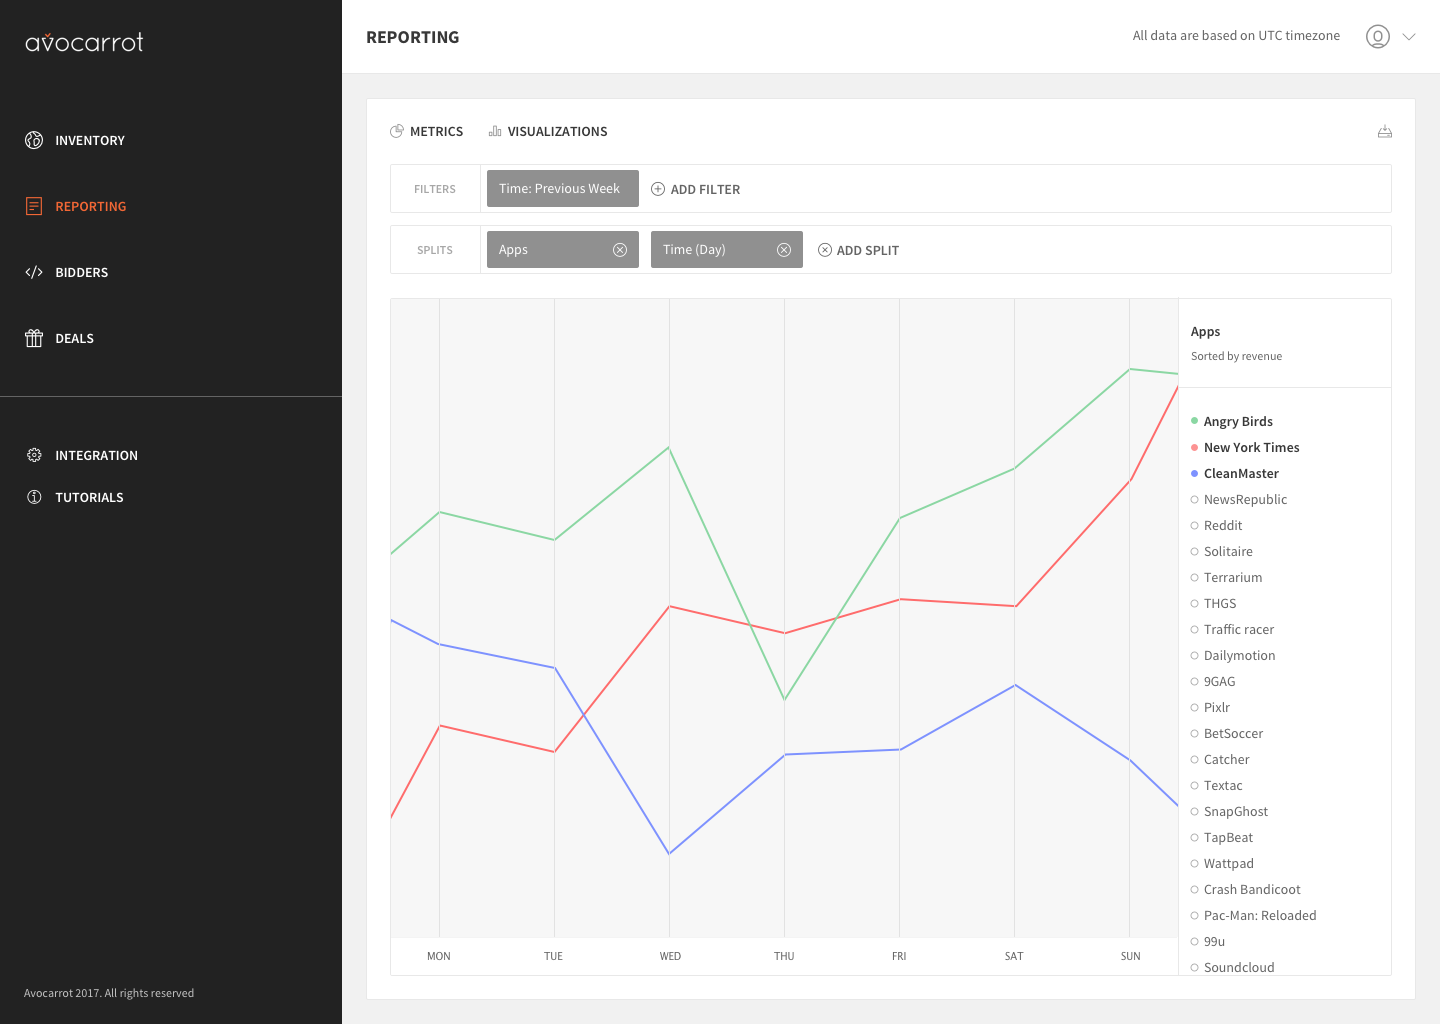
Given the requirements this reporting interface had, I decided to make the dimensions (filter/splits) the first thing a DSP would see. Dimensions were distinguished in 2 major categories, filters and splits. Filters were filtering the data, while splits were splitting the filtered data. Manipulating filters or splits was the primary action, since they’d change the whole reporting view. Plus, we made the educated assumption that changing the dimensions would be the highest frequency action.
The secondary actions, would be the options to add or remove metrics, visualisations or export a .csv with data. These were secondary actions due to their frequency.
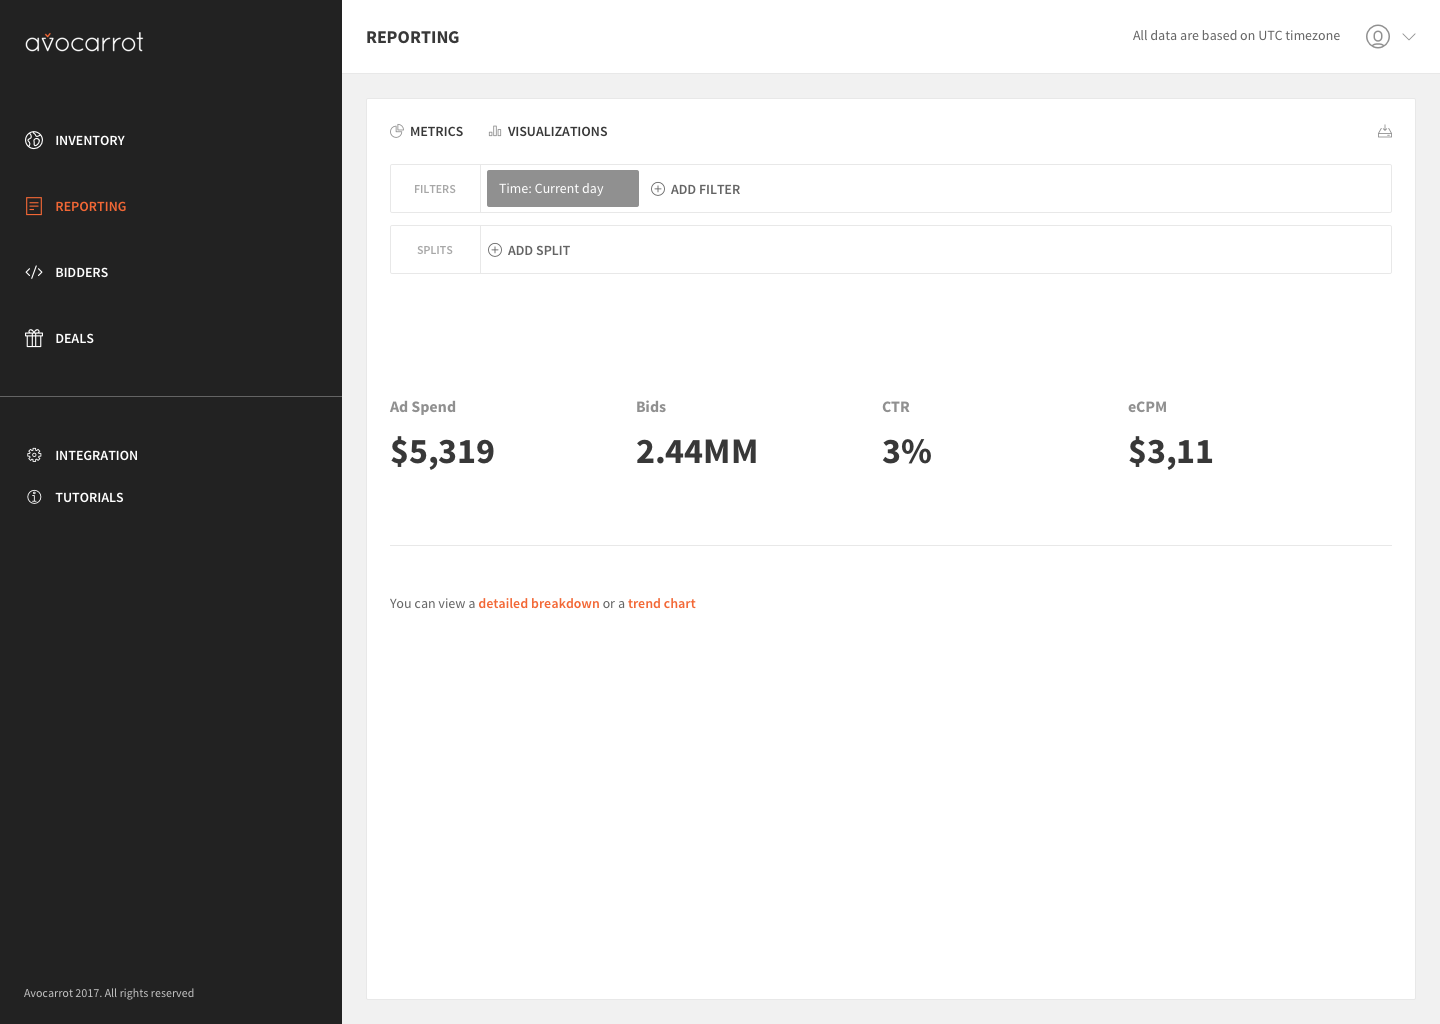
We picked 3 possible visualisations: Totals, Table and Time-series. The rational was that we could cover all the possible needs with these three, while we keep it short and not overwhelm the user with options:
-
1. The totals, would give you a quick glance for all the dimensions you had chosen.
-
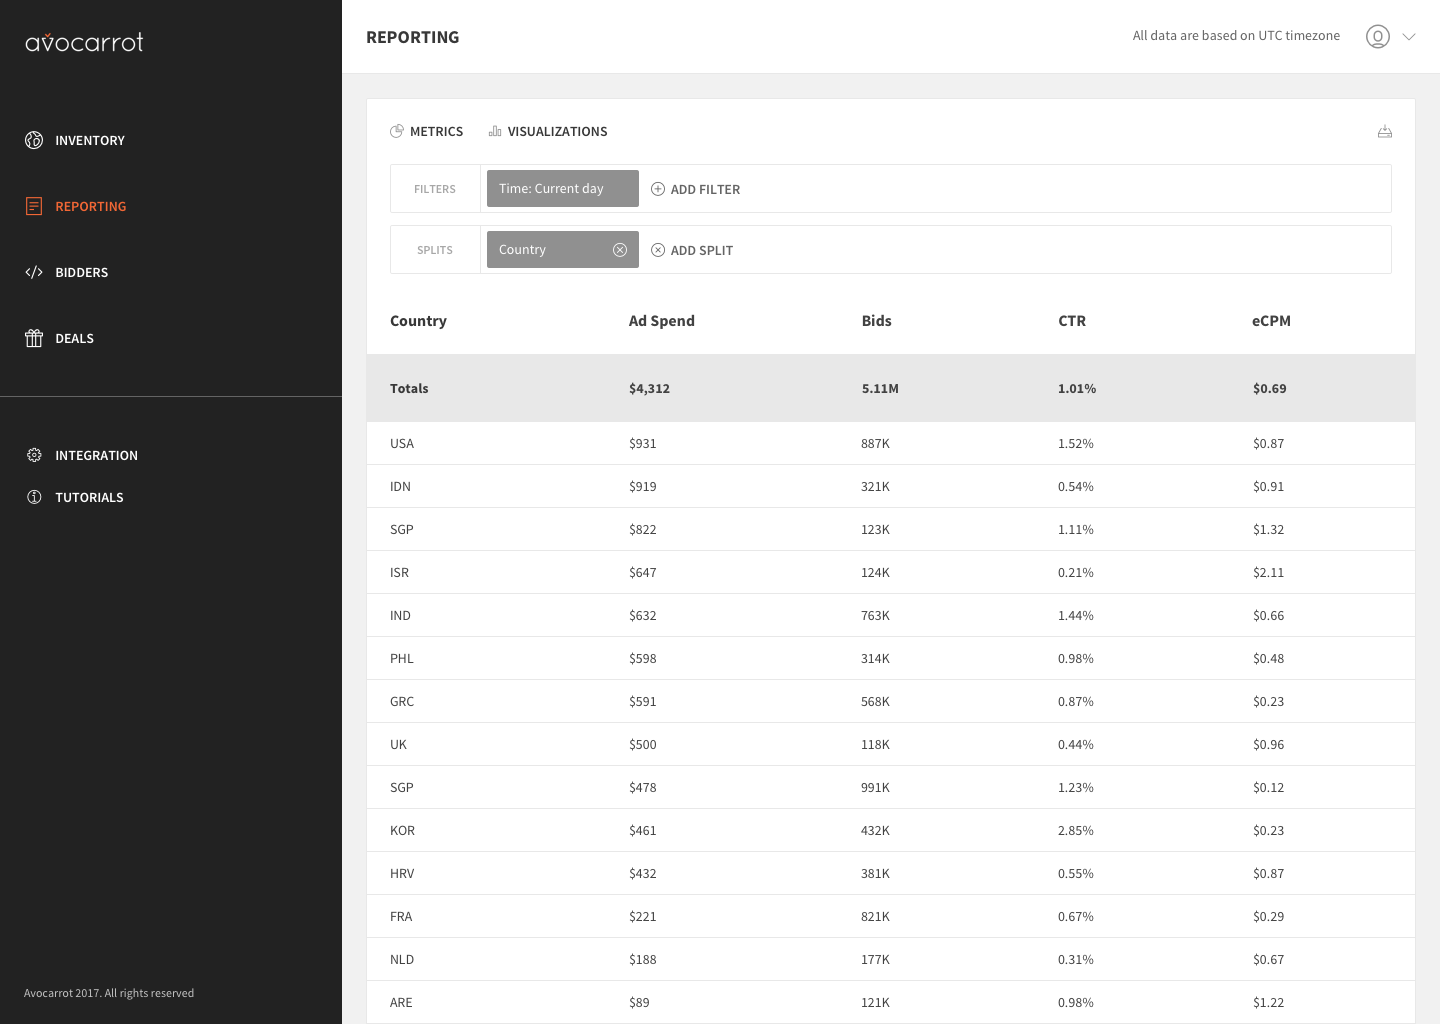
2. The table, would give you a more detailed view and a table breakdown on data splitted by 1 or more dimension(s).
-
3. The time-series, would give you the trend and the high level sanity check that everything works as it should.
As a side note, there was this little logic inside this interface. We had mapped it out early on the design process we follow. This logic was all about ruling. We had specific rules for each visualization, such as you couldn’t produce a time-series view, without having time dimension as a split. Or that you couldn’t produce a table view, without having at least 1 split.
We did our best to make it easily understandable inside the interface that this ruling exists. When a DSP clicked on time-series visualisation without having time as a dimension, a message “You need to split by time in order to view a time-series graph” with a following CTA “Split by time” would appear. Hitting “Split by time” CTA would add the time dimension with a default value (per day). We choose carefully the default values, from the average usage we see on analytics. “Per day” was by far the most popular one, that’s why we chose to go with it.
Impact
We rolled this reporting out quite carefully, by opening a beta to certain Demand Side Partners. We changed the spreadsheet link in the weekly mail with the dashboard one (and a generated username/password too!). We had Google Analytics and HotJar installed to measure how DSPs are using our product. We had set up session cams via HotJar and we identified that they had an easy time navigating around and make queries on the fly. Gladly, it made sense to them. In addition, they responded to the weekly mail with great appreciation for the efficiency we had just introduced.
The product felt robust and full, and the functionality was there. One thing we keep getting qualitative feedback for was the list of dimensions. We started off with the basic dimensions (time, apps, countries etc) but soon DSPs started asking for more sophisticated dimensions such as OS, OS Version, Device Type/Name etc. Including all these additional dimensions was the main thing we keep iterating on this product.
ECPM FLOORS
Iterating on a popular feature that used almost everyday until it fits the needs
VIEW MORE